படிமம்:Bank Common Equity to Assets Ratios 2004 - 2008.png
மூலக்கோப்பு (960 × 720 படவணுக்கள், கோப்பின் அளவு: 12 KB, MIME வகை: image/png)
| இது விக்கிமீடியா பொதுக்கோப்பகத்தில் இருக்கும் ஒரு கோப்பாகும். இக்கோப்பைக் குறித்து அங்கே காணப்படும் படிம விளக்கப் பக்கத்தை இங்கே கீழே காணலாம்.
|
சுருக்கம்
| விளக்கம் |
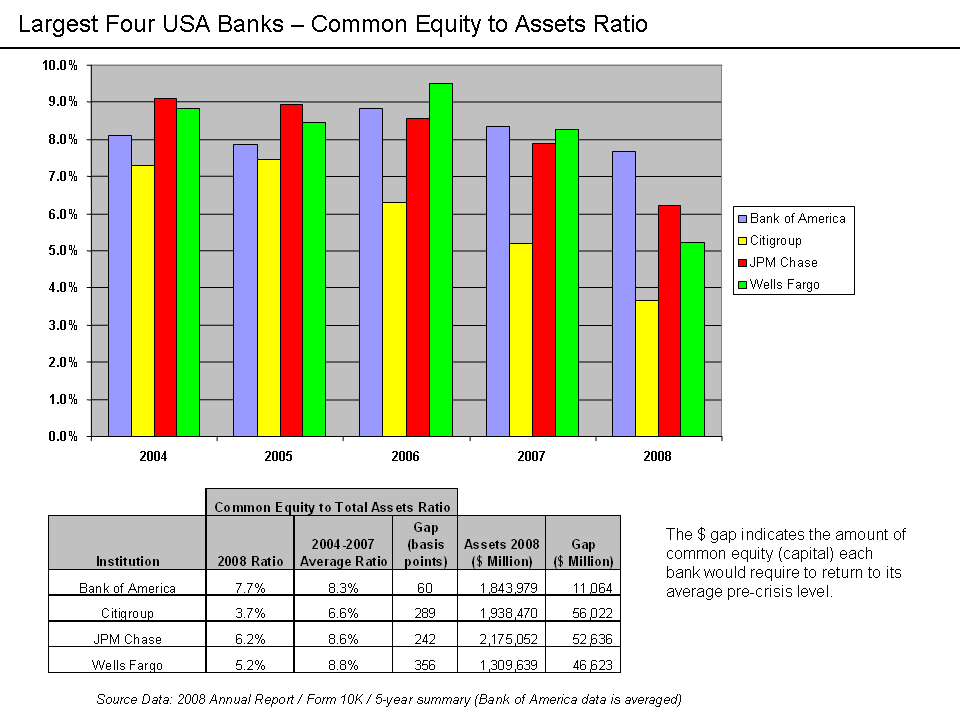
English: Common Equity to Total Assets Ratios for major U.S. banks Source DataThe source data is from the 2008 annual reports of each company available on their website. There is a five year annual summary that contains the source data used. Note that Bank of America (unlike the others) averages its numbers. A basis point is 1/100th of a percentage point. The concept of the gap analysis is to indicate how much additional common stock equity each bank would have to acquire to return to its 2004-2007 average ratio. Computation steps:
The amounts are in millions. For example, Wells Fargo would require $46.6 billion to return to its pre-crisis level of common equity capitalization. Alan Greenspan wrote in a March 2009 article that U.S. banks would require another $850 billion in his estimation, representing "an additional 3-4 percentage points of cushion in their equity capital to assets ratios."[1] |
| நாள் | |
| மூலம் | Annual Reports of each entity |
| ஆசிரியர் | Farcaster (talk) 05:12, 4 May 2009 (UTC) |
அனுமதி
- நீங்கள் சுதந்திரமாக:
- பகிர்ந்து கொள்ள – வேலையை நகலெடுக்க, விநியோகிக்க மற்றும் அனுப்ப
- மீண்டும் கலக்க – வேலைக்கு பழகிக்கொள்ள.
- கீழ்க்காணும் விதிகளுக்கு ஏற்ப,
- பண்புக்கூறுகள் – நீங்கள் பொருத்தமான உரிமையை வழங்க வேண்டும், உரிமத்திற்கான இணைப்பை வழங்க வேண்டும் மற்றும் மாற்றங்கள் செய்யப்பட்டிருந்தால் குறிப்பிட வேண்டும். நீங்கள் ஏற்புடைய எந்த முறையிலும் அவ்வாறு செய்யலாம், ஆனால் எந்த வகையிலும் உரிமதாரர் உங்களை அல்லது உங்கள் பயன்பாட்டிற்கு ஒப்புதல் அளிக்கும் படி பரிந்துரைக்க கூடாது.
- அதே மாதிரி பகிர் – நீங்கள் ரீமிக்ஸ் செய்தாலோ, உருமாற்றம் செய்தாலோ அல்லது பொருளை உருவாக்கினாலோ, உங்கள் பங்களிப்புகளை அல்லது இணக்கமான உரிமம் கீழ் அசலாக விநியோகிக்க வேண்டும்.

|
GNU Free Documentation License விதிமுறைகளின் கீழ் இந்த ஆவணத்தை நகலெடுக்க, விநியோகிக்க மற்றும்/அல்லது மாற்றுவதற்கு அனுமதி வழங்கப்பட்டுள்ளது, Free Software Foundation;ஆல் வெளியிடப்பட்ட பதிப்பு 1.2 அல்லது அதற்குப் பிந்தைய பதிப்பு, மாற்றமில்லாத பிரிவுகள், முன் அட்டை உரைகள் மற்றும் பின் அட்டை உரைகள் இல்லாமல் வெளியிடப்பட்டது. GNU Free Documentation License என்ற தலைப்பில் உரிமத்தின் நகல் சேர்க்கப்பட்டுள்ளது. |
Original upload log
- 2009-05-04 05:12 Farcaster 960×720× (12704 bytes) {{Information |Description = Common Equity to Total Assets Ratios for major U.S. banks |Source = Annual Reports of each entity |Date = May 4, 2009 |Author = ~~~~ |other_versions = }}
கோப்பின் வரலாறு
குறித்த நேரத்தில் இருந்த படிமத்தைப் பார்க்க அந்நேரத்தின் மீது சொடுக்கவும்.
| நாள்/நேரம் | நகம் அளவு சிறுபடம் | அளவுகள் | பயனர் | கருத்து | |
|---|---|---|---|---|---|
| தற்போதைய | 01:11, 14 அக்டோபர் 2010 | | 960 × 720 (12 KB) | Hideokun | {{Information |Description={{en|Common Equity to Total Assets Ratios for major U.S. banks<br/> ==Source Data== The source data is from the 2008 annual reports of each company available on their website. There is a five year annual summary that contains th |
கோப்பு பயன்பாடு
பின்வரும் பக்க இணைப்புகள் இப் படிமத்துக்கு இணைக்கபட்டுள்ளது(ளன):
கோப்பின் முழுமையான பயன்பாடு
கீழ்கண்ட மற்ற விக்கிகள் இந்த கோப்பை பயன்படுத்துகின்றன:
- en.wikipedia.org-திட்டத்தில் இதன் பயன்பாடு
- hi.wikipedia.org-திட்டத்தில் இதன் பயன்பாடு
- ja.wikipedia.org-திட்டத்தில் இதன் பயன்பாடு