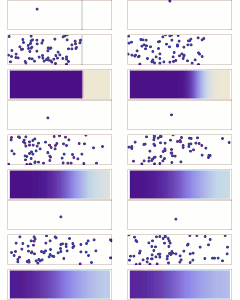
DiffusionMicroMacro.gif(360 × 300 படவணுக்கள், கோப்பின் அளவு: 402 KB, MIME வகை: image/gif, வளயமிடப்பட்டது.(looped), 60 சட்டகங்கள், 6.5 s)

இது விக்கிமீடியா பொதுக்கோப்பகத்தில் இருக்கும் ஒரு கோப்பாகும். இக்கோப்பைக் குறித்து அங்கே காணப்படும் படிம விளக்கப் பக்கத்தை இங்கே கீழே காணலாம்.
பொதுக்கோப்பகம் ஒரு கட்டற்ற கோப்புகளின் சேமிப்பகமாகும். நீங்களும் உதவலாம்.

Template loop detected: Template:Autotranslate <includeonly></includeonly>

சுருக்கம்

விளக்கம்
English: Diffusion from a microscopic and macroscopic point of view. Initially, there are solute molecules on the left side of a barrier (magenta line) and none on the right. The barrier is removed, and the solute diffuses to fill the whole container. Top: A single molecule moves around randomly. Middle: With more molecules, there is a clear trend where the solute fills the container more and more evenly. Bottom: With an enormous number of solute molecules, the randomness is gone: The solute appears to move smoothly and systematically from high-concentration areas to low-concentration areas, following Fick's laws. Image is made in Mathematica, source code below.
நாள்
மூலம் சொந்த முயற்சி
ஆசிரியர் Sbyrnes321

அனுமதி

Public domain I, the copyright holder of this work, release this work into the public domain. This applies worldwide.
சில நாடுகளில் இது சாத்தியமில்லாது போகலாம். அவ்வாறாயின் :
I grant anyone the right to use this work for any purpose, without any conditions, unless such conditions are required by law.

<< Mathematica source code >>

(* Source code written in Mathematica 6.0, by Steve Byrnes, 2010.
I release this code into the public domain. Sorry it's messy...email me any questions. *)

(*Particle simulation*)
SeedRandom[1];
NumParticles = 70;
xMax = 0.7;
yMax = 0.2;
xStartMax = 0.5;
StepDist = 0.04;
InitParticleCoordinates = Table[{RandomReal[{0, xStartMax}], RandomReal[{0, yMax}]}, {i, 1, NumParticles}];
StayInBoxX[x_] := If[x < 0, -x, If[x > xMax, 2 xMax - x, x]];
StayInBoxY[y_] := If[y < 0, -y, If[y > yMax, 2 yMax - y, y]];
StayInBoxXY[xy_] := {StayInBoxX[xy[[1]]], StayInBoxY[xy[[2]]]};
StayInBarX[x_] := If[x < 0, -x, If[x > xStartMax, 2 xStartMax - x, x]];
StayInBarY[y_] := If[y < 0, -y, If[y > yMax, 2 yMax - y, y]];
StayInBarXY[xy_] := {StayInBarX[xy[[1]]], StayInBarY[xy[[2]]]};
MoveAStep[xy_] := StayInBoxXY[xy + {RandomReal[{-StepDist, StepDist}], RandomReal[{-StepDist, StepDist}]}];
MoveAStepBar[xy_] := StayInBarXY[xy + {RandomReal[{-StepDist, StepDist}], RandomReal[{-StepDist, StepDist}]}];
NextParticleCoordinates[ParticleCoords_] := MoveAStep /@ ParticleCoords;
NextParticleCoordinatesBar[ParticleCoords_] := MoveAStepBar /@ ParticleCoords;
NumFramesBarrier = 10;
NumFramesNoBarrier = 50;
NumFrames = NumFramesBarrier + NumFramesNoBarrier;
ParticleCoordinatesTable = Table[0, {i, 1, NumFrames}];
ParticleCoordinatesTable[[1]] = InitParticleCoordinates;
For[i = 2, i <= NumFrames, i++,
  If[i <= NumFramesBarrier,
   ParticleCoordinatesTable[[i]] = NextParticleCoordinatesBar[ParticleCoordinatesTable[[i - 1]]], 
   ParticleCoordinatesTable[[i]] = NextParticleCoordinates[ParticleCoordinatesTable[[i - 1]]]];];

(*Plot full particle simulation*)
makeplotbar[ParticleCoord_] := 
  ListPlot[{ParticleCoord, {{xStartMax, 0}, {xStartMax, yMax}}}, Frame -> True, Axes -> False,
   PlotRange -> {{0, xMax}, {0, yMax}}, Joined -> {False, True}, PlotStyle -> {PointSize[.03], Thick},
   AspectRatio -> yMax/xMax, FrameTicks -> None];

makeplot[ParticleCoord_] := 
 ListPlot[ParticleCoord, Frame -> True, Axes -> False, PlotRange -> {{0, xMax}, {0, yMax}}, Joined -> False, 
  PlotStyle -> PointSize[.03], AspectRatio -> yMax/xMax, FrameTicks -> None]

ParticlesPlots = 
  Join[Table[makeplotbar[ParticleCoordinatesTable[[i]]], {i, 1, NumFramesBarrier}], 
   Table[makeplot[ParticleCoordinatesTable[[i]]], {i, NumFramesBarrier + 1, NumFrames}]];

(*Plot just the first particle in the list...Actually the fifth particle looks better. *) 
FirstParticleTable = {#[[5]]} & /@ ParticleCoordinatesTable;

FirstParticlePlots = 
  Join[Table[makeplotbar[FirstParticleTable[[i]]], {i, 1, NumFramesBarrier}], 
   Table[makeplot[FirstParticleTable[[i]]], {i, NumFramesBarrier + 1, NumFrames}]];


(* Continuum solution *)

(* I can use the simple diffusion-on-an-infinite-line formula, as long as I correctly periodically replicate the
initial condition. Actually just computed nearest five replicas in each direction, that was a fine approximation. *)

(* k = diffusion coefficient, visually matched to simulation. *)
k = .0007; 
u[x_, t_] := If[t == 0, If[x <= xStartMax, 1, 0], 1/2 Sum[
     Erf[(x - (-xStartMax + 2 n xMax))/Sqrt[4 k t]] - Erf[(x - (xStartMax + 2 n xMax))/Sqrt[4 k t]], {n, -5, 5}]];

ContinuumPlots = Join[
   Table[Show[
     DensityPlot[1 - u[x, 0], {x, 0, xMax}, {y, 0, yMax}, 
      ColorFunctionScaling -> False, AspectRatio -> yMax/xMax, 
      FrameTicks -> None],
     ListPlot[{{xStartMax, 0}, {xStartMax, yMax}}, Joined -> True, 
      PlotStyle -> {Thick, Purple}]],
    {i, 1, NumFramesBarrier}],
   Table[
    DensityPlot[1 - u[x, tt], {x, 0, xMax}, {y, 0, yMax}, 
     ColorFunctionScaling -> False, AspectRatio -> yMax/xMax, 
     FrameTicks -> None],
    {tt, 1, NumFramesNoBarrier}]];

(*Combine and export *)

TogetherPlots = 
  Table[GraphicsGrid[{{FirstParticlePlots[[i]]}, {ParticlesPlots[[i]]}, {ContinuumPlots[[i]]}},
   Spacings -> Scaled[0.2]], {i, 1, NumFrames}];

Export["test.gif", Join[TogetherPlots, Table[Graphics[], {i, 1, 5}]], 
 "DisplayDurations" -> {10}, "AnimationRepititions" -> Infinity ]

Captions

Add a one-line explanation of what this file represents

Items portrayed in this file

depicts ஆங்கிலம்

some value

author name string ஆங்கிலம்: Sbyrnes321
Wikimedia username ஆங்கிலம்: Sbyrnes321

source of file ஆங்கிலம்

original creation by uploader ஆங்கிலம்

16 சனவரி 2010

கோப்பின் வரலாறு

குறித்த நேரத்தில் இருந்த படிமத்தைப் பார்க்க அந்நேரத்தின் மீது சொடுக்கவும்.

நாள்/நேரம்நகம் அளவு சிறுபடம்அளவுகள்பயனர்கருத்து
தற்போதைய13:41, 7 மார்ச்சு 201213:41, 7 மார்ச்சு 2012 இலிருந்த பதிப்புக்கான சிறு தோற்றம்360 × 300 (402 KB)Dratini0Just removed the white last fram for aesthetic purposes, and prologed the display time of the last frame to mark the reatart of the animation.
19:37, 25 மார்ச்சு 201019:37, 25 மார்ச்சு 2010 இலிருந்த பதிப்புக்கான சிறு தோற்றம்360 × 300 (402 KB)AiyizoOptimized animation, converted to 256 color mode
09:57, 16 சனவரி 201009:57, 16 சனவரி 2010 இலிருந்த பதிப்புக்கான சிறு தோற்றம்360 × 300 (529 KB)Sbyrnes321sped up bottom panel to match better with middle panel
09:46, 16 சனவரி 201009:46, 16 சனவரி 2010 இலிருந்த பதிப்புக்கான சிறு தோற்றம்360 × 300 (508 KB)Sbyrnes321{{Information |Description={{en|1=Diffusion from a microscopic and macroscopic point of view. Initially, there are solute molecules on the left side of a barrier (purple line) and none on the right. The barrier is removed, and the solute diffuses to fill

பின்வரும் 2 பக்கங்கள் இணைப்பு இப் படிமத்துக்கு இணைக்கபட்டுள்ளது(ளன):

கோப்பின் முழுமையான பயன்பாடு

கீழ்கண்ட மற்ற விக்கிகள் இந்த கோப்பை பயன்படுத்துகின்றன:

சிறப்பு பக்கம்-மொத்த பயன்பாடு - இதன் மூலம் இந்த கோப்பின் மொத்த பயன்பாட்டை அறிய முடியும்

"https://ta.wikipedia.org/wiki/படிமம்:DiffusionMicroMacro.gif" இலிருந்து மீள்விக்கப்பட்டது