படிமம்:Global greenhouse gas emissions by sector, 1990-2005, in carbon dioxide equivalents (EPA, 2010).png

மூலக்கோப்பு(670 × 610 படவணுக்கள், கோப்பின் அளவு: 31 KB, MIME வகை: image/png)

இது விக்கிமீடியா பொதுக்கோப்பகத்தில் இருக்கும் ஒரு கோப்பாகும். இக்கோப்பைக் குறித்து அங்கே காணப்படும் படிம விளக்கப் பக்கத்தை இங்கே கீழே காணலாம்.
பொதுக்கோப்பகம் ஒரு கட்டற்ற கோப்புகளின் சேமிப்பகமாகும். நீங்களும் உதவலாம்.

சுருக்கம்

விளக்கம்
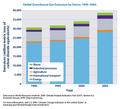
English: This bar graph shows global greenhouse gas emissions by sector from 1990 to 2005, measured in carbon dioxide equivalents. Sectors are waste (green), industrial processes (purple), agriculture (grey), international transport (orange), and energy (blue). Global sectoral emissions are shown for the years 1990, 1995, 2000, and 2005. From the cited public-domain source: "Energy use is the largest source of greenhouse gas emissions worldwide (about 73 percent of the total), followed by agriculture (16 to 17 percent) [...]." Totals do not include emissions due to land use change or forestry because estimates are not available for the most recent years. The bar graph is based on data from the World Resources Institute: Climate Analysis Indicators Tool (CAIT). Version 6.0. Accessed January 2009.
நாள்
மூலம் Climate Change Indicators in the United States: Figure 2. Global Greenhouse Gas Emissions by Sector, 1990-2005. Page 12 of PDF. Published 2010.
ஆசிரியர் US Environmental Protection Agency
அனுமதி
(இக்கோப்பை மீண்டும் பயன்படுத்துதல்)
EPA Climate Change FAQ > Topic > Website > Can I use this graphic/information I found on your website? Topic #: 23002-14698, Date Created: 9/2/2007, Last Modified Since: 6/6/2012: "[...] All of the graphics and information on EPA’s Climate Change Web site, with the exception of the graphics from the Koshland Science Museum of the National Academy of Sciences, and the EPA seal and logo are in the public domain. A credit is appreciated (e.g. Source: U.S. EPA Climate Change Website) [...]"

அனுமதி

Public domain
Public domain
This image (or other media) is a work of an Environmental Protection Agency employee, taken or made as part of that person's official duties. As works of the U.S. federal government, all EPA images are in the public domain.

EPA logo
EPA logo
العربية  Deutsch  English  eesti  italiano  日本語  македонски  Nederlands  polski  português  sicilianu  slovenščina  ไทย  українська  简体中文  繁體中文  +/−

Captions

Add a one-line explanation of what this file represents

Items portrayed in this file

depicts ஆங்கிலம்

1 சனவரி 2010

கோப்பின் வரலாறு

குறித்த நேரத்தில் இருந்த படிமத்தைப் பார்க்க அந்நேரத்தின் மீது சொடுக்கவும்.

நாள்/நேரம்நகம் அளவு சிறுபடம்அளவுகள்பயனர்கருத்து
தற்போதைய17:46, 28 சூலை 201217:46, 28 சூலை 2012 இலிருந்த பதிப்புக்கான சிறு தோற்றம்670 × 610 (31 KB)Enescot{{Information |Description ={{en|1=This bar graph shows global greenhouse gas emissions by sector from 1990 to 2005, measured in carbon dioxide equivalents. Sectors are waste (green), industri...

பின்வரும் பக்க இணைப்புகள் இப் படிமத்துக்கு இணைக்கபட்டுள்ளது(ளன):

கோப்பின் முழுமையான பயன்பாடு

கீழ்கண்ட மற்ற விக்கிகள் இந்த கோப்பை பயன்படுத்துகின்றன:

மேனிலைத் தரவு