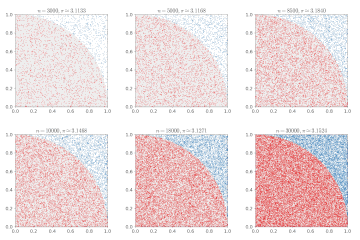
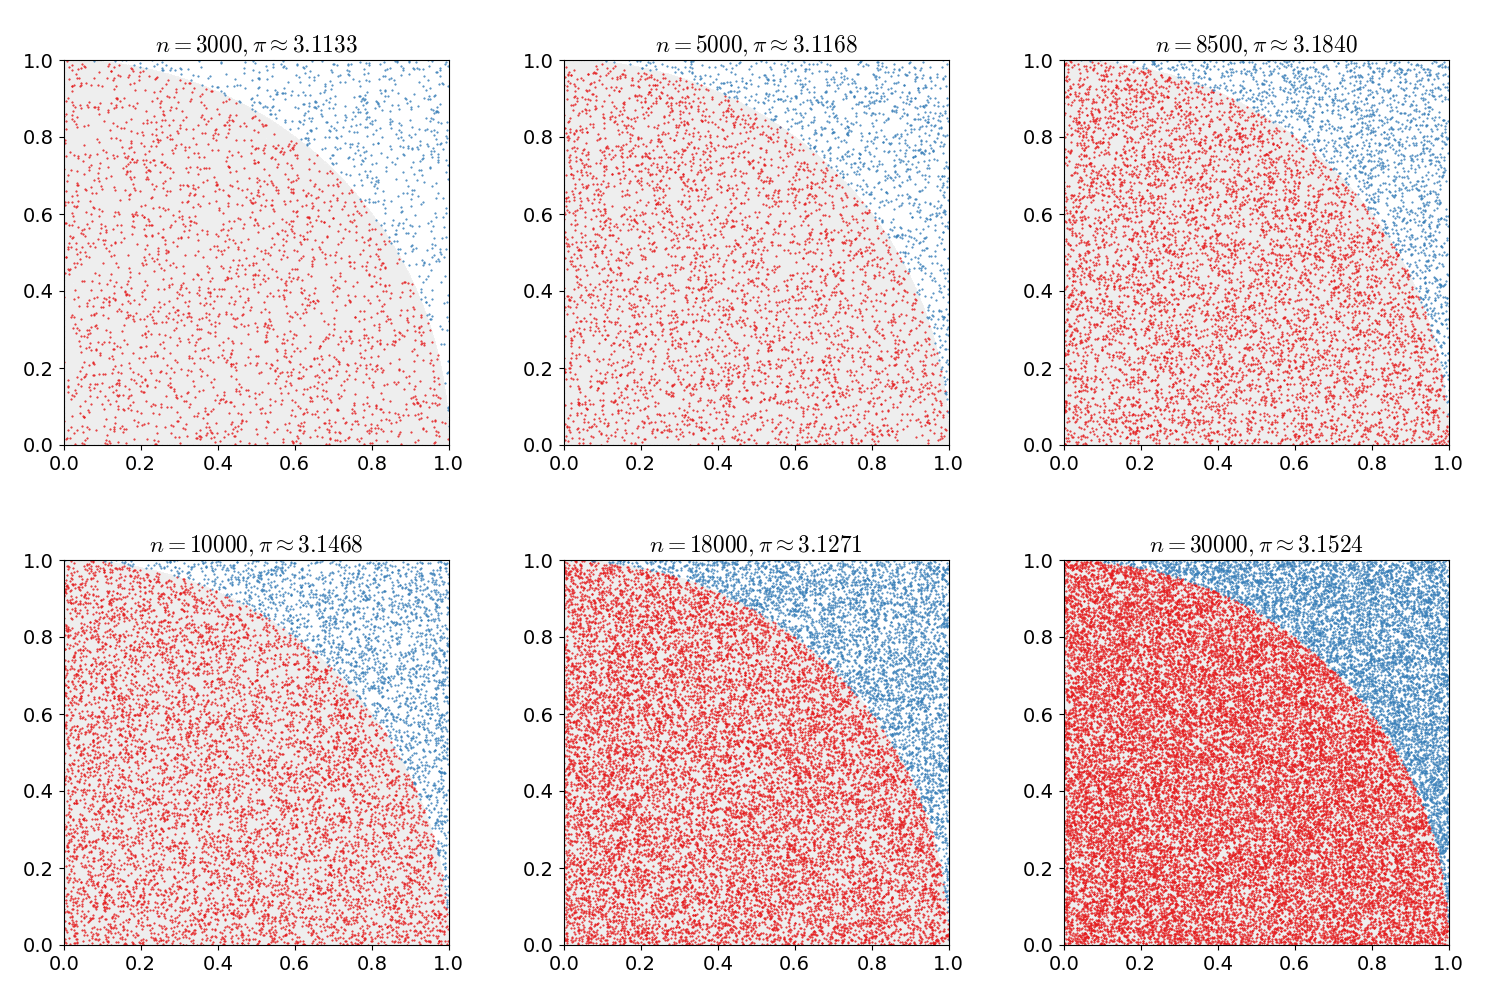
படிமம்:Pi 30K.gif
Pi_30K.gif (500 × 500 படவணுக்கள், கோப்பின் அளவு: 476 KB, MIME வகை: image/gif, வளயமிடப்பட்டது.(looped), 10 சட்டகங்கள், 2.0 s)
கோப்பின் வரலாறு
குறித்த நேரத்தில் இருந்த படிமத்தைப் பார்க்க அந்நேரத்தின் மீது சொடுக்கவும்.
| நாள்/நேரம் | நகம் அளவு சிறுபடம் | அளவுகள் | பயனர் | கருத்து | |
|---|---|---|---|---|---|
| தற்போதைய | 16:00, 16 பெப்பிரவரி 2017 |  | 500 × 500 (476 KB) | Nicoguaro | Make the plot square and increase gif delay. |
| 15:38, 16 பெப்பிரவரி 2017 |  | 640 × 480 (476 KB) | Nicoguaro | Bigger text in the axes, and colors from ColorBrewer. Code in Python. | |
| 18:29, 7 நவம்பர் 2011 |  | 500 × 500 (373 KB) | Rayhem | Slowed animation to avoid looking like a blinky page element, improved resolution, added counter for number of points, shaded points inside/outside the circle. ==Mathematica 7.0 Source== <pre> tinyColor[color_, point_] := {PointSize[Small], color, Point[ | |
| 23:12, 14 மார்ச்சு 2011 |  | 360 × 369 (363 KB) | CaitlinJo | {{Information |Description ={{en|1=As points are randomly scattered inside the unit square, some fall within the unit circle. The fraction of points inside the circle over all points approaches pi as the number of points goes toward infinity. This ani |
கோப்பு பயன்பாடு
பின்வரும் பக்க இணைப்புகள் இப் படிமத்துக்கு இணைக்கபட்டுள்ளது(ளன):
கோப்பின் முழுமையான பயன்பாடு
கீழ்கண்ட மற்ற விக்கிகள் இந்த கோப்பை பயன்படுத்துகின்றன:
- ar.wikipedia.org-திட்டத்தில் இதன் பயன்பாடு
- be.wikipedia.org-திட்டத்தில் இதன் பயன்பாடு
- bg.wikipedia.org-திட்டத்தில் இதன் பயன்பாடு
- ca.wikipedia.org-திட்டத்தில் இதன் பயன்பாடு
- da.wikipedia.org-திட்டத்தில் இதன் பயன்பாடு
- el.wikipedia.org-திட்டத்தில் இதன் பயன்பாடு
- en.wikipedia.org-திட்டத்தில் இதன் பயன்பாடு
- en.wikibooks.org-திட்டத்தில் இதன் பயன்பாடு
- eo.wikipedia.org-திட்டத்தில் இதன் பயன்பாடு
- eu.wikipedia.org-திட்டத்தில் இதன் பயன்பாடு
- fa.wikipedia.org-திட்டத்தில் இதன் பயன்பாடு
- fr.wikipedia.org-திட்டத்தில் இதன் பயன்பாடு
- he.wikipedia.org-திட்டத்தில் இதன் பயன்பாடு
- hi.wikipedia.org-திட்டத்தில் இதன் பயன்பாடு
- id.wikipedia.org-திட்டத்தில் இதன் பயன்பாடு
- it.wikipedia.org-திட்டத்தில் இதன் பயன்பாடு
- ja.wikipedia.org-திட்டத்தில் இதன் பயன்பாடு
- ko.wikipedia.org-திட்டத்தில் இதன் பயன்பாடு
- pt.wikipedia.org-திட்டத்தில் இதன் பயன்பாடு
- sh.wikipedia.org-திட்டத்தில் இதன் பயன்பாடு
- simple.wikipedia.org-திட்டத்தில் இதன் பயன்பாடு
- sl.wikipedia.org-திட்டத்தில் இதன் பயன்பாடு
- sr.wikipedia.org-திட்டத்தில் இதன் பயன்பாடு
- sv.wikipedia.org-திட்டத்தில் இதன் பயன்பாடு
- test.wikipedia.org-திட்டத்தில் இதன் பயன்பாடு
- tr.wikipedia.org-திட்டத்தில் இதன் பயன்பாடு
- uk.wikipedia.org-திட்டத்தில் இதன் பயன்பாடு
- vi.wikipedia.org-திட்டத்தில் இதன் பயன்பாடு
- www.wikidata.org-திட்டத்தில் இதன் பயன்பாடு
- zh-yue.wikipedia.org-திட்டத்தில் இதன் பயன்பாடு
- zh.wikipedia.org-திட்டத்தில் இதன் பயன்பாடு
