படிமம்:South Africa 2011 population density map.svg

Size of this PNG preview of this SVG file: 684 × 599 படப்புள்ளிகள். மற்ற பிரிதிறன்கள்: 274 × 240 படப்புள்ளிகள் | 548 × 480 படப்புள்ளிகள் | 876 × 768 படப்புள்ளிகள் | 1,168 × 1,024 படப்புள்ளிகள் | 2,337 × 2,048 படப்புள்ளிகள் | 809 × 709 படப்புள்ளிகள் .
மூலக்கோப்பு (SVG கோப்பு, பெயரளவில் 809 × 709 பிக்சல்கள், கோப்பு அளவு: 1.93 MB)
| இது விக்கிமீடியா பொதுக்கோப்பகத்தில் இருக்கும் ஒரு கோப்பாகும். இக்கோப்பைக் குறித்து அங்கே காணப்படும் படிம விளக்கப் பக்கத்தை இங்கே கீழே காணலாம்.
|
சுருக்கம்
| விளக்கம் |
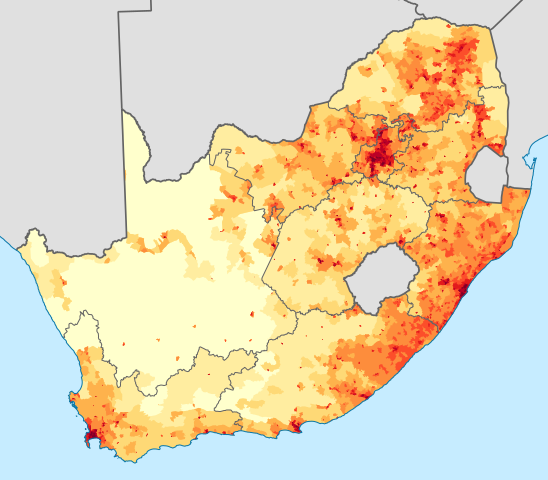
English: Population density map of South Africa, based on the 2011 census using ward-level data.
<1 inhabitant/km²
1–3 inhabitants/km²
3–10 inhabitants/km²
10–30 inhabitants/km²
30–100 inhabitants/km²
100–300 inhabitants/km²
300–1000 inhabitants/km²
1000–3000 inhabitants/km²
>3000 inhabitants/km²
Projection is Albers Equal-Area Conic, with standard parallels at 25.5° S and 31.5° S, and origin at 28.5° S 24.5° E.Deutsch: Bevölkerungsdichte Südafrikas im Jahr 2011:
<1 Einwohner/km²
1–3 Einwohner/km²
3–10 Einwohner/km²
10–30 Einwohner/km²
30–100 Einwohner/km²
100–300 Einwohner/km²
300–1000 Einwohner/km²
1000–3000 Einwohner/km²
>3000 Einwohner/km² |
| நாள் | |
| மூலம் | Statistics South Africa's Census 2011 is the source of the basic population data. The map results from my own processing of the data. For ward boundaries see File:South Africa electoral wards 2011 blank.svg. |
| ஆசிரியர் | Htonl |
| ஒத்தக்கோப்பு |
South Africa 2011 population density map (hex cells).svg: .svg) |
அனுமதி
The following license applies to the population data on which the map is based:

|
The copyright holder of this file, Stats SA, allows anyone to use it for any purpose, provided that the copyright holder is properly attributed. Redistribution, derivative work, commercial use, and all other use is permitted. |
பண்புக்கூறுகள்:
"the user acknowledges Stats SA as the source of the basic data wherever they process, apply, utilise, publish or distribute the data, and also that they specify that the relevant application and analysis (where applicable) result from their own processing of the data" [1]
|
The following tag applies to the map itself:
| I, the copyright holder of this work, release this work into the public domain. This applies worldwide. சில நாடுகளில் இது சாத்தியமில்லாது போகலாம். அவ்வாறாயின் : I grant anyone the right to use this work for any purpose, without any conditions, unless such conditions are required by law. |
கோப்பின் வரலாறு
குறித்த நேரத்தில் இருந்த படிமத்தைப் பார்க்க அந்நேரத்தின் மீது சொடுக்கவும்.
| நாள்/நேரம் | நகம் அளவு சிறுபடம் | அளவுகள் | பயனர் | கருத்து | |
|---|---|---|---|---|---|
| தற்போதைய | 23:36, 14 நவம்பர் 2012 | | 809 × 709 (1.93 MB) | Htonl | fix KZN coast error |
| 21:57, 14 நவம்பர் 2012 |  | 809 × 709 (1.93 MB) | Htonl | == {{int:filedesc}} == {{Information |Description={{en|1=Population density map of South Africa, based on the 2011 census using ward-level data. {{legend|#ffffcc|<1 inhabitant/km²}} {{legend|#ffeda0|1–3 inhabitants/km²}} {{legend|#fed976|3–10 ... |
கோப்பு பயன்பாடு
இப் படிமத்துக்கு இணைக்கப்பட்டுள்ள பக்கங்கள் எதுவும் இல்லை.
கோப்பின் முழுமையான பயன்பாடு
கீழ்கண்ட மற்ற விக்கிகள் இந்த கோப்பை பயன்படுத்துகின்றன:
- af.wikipedia.org-திட்டத்தில் இதன் பயன்பாடு
- azb.wikipedia.org-திட்டத்தில் இதன் பயன்பாடு
- az.wikipedia.org-திட்டத்தில் இதன் பயன்பாடு
- ca.wikipedia.org-திட்டத்தில் இதன் பயன்பாடு
- cs.wikipedia.org-திட்டத்தில் இதன் பயன்பாடு
- de.wikipedia.org-திட்டத்தில் இதன் பயன்பாடு
- el.wikipedia.org-திட்டத்தில் இதன் பயன்பாடு
- en.wikipedia.org-திட்டத்தில் இதன் பயன்பாடு
- es.wikipedia.org-திட்டத்தில் இதன் பயன்பாடு
- et.wikipedia.org-திட்டத்தில் இதன் பயன்பாடு
- fr.wikipedia.org-திட்டத்தில் இதன் பயன்பாடு
- gl.wikipedia.org-திட்டத்தில் இதன் பயன்பாடு
- he.wikipedia.org-திட்டத்தில் இதன் பயன்பாடு
- hu.wikipedia.org-திட்டத்தில் இதன் பயன்பாடு
- hy.wikipedia.org-திட்டத்தில் இதன் பயன்பாடு
- ja.wikipedia.org-திட்டத்தில் இதன் பயன்பாடு
- ka.wikipedia.org-திட்டத்தில் இதன் பயன்பாடு
- ko.wikipedia.org-திட்டத்தில் இதன் பயன்பாடு
- la.wikipedia.org-திட்டத்தில் இதன் பயன்பாடு
- lt.wikipedia.org-திட்டத்தில் இதன் பயன்பாடு
- ml.wikipedia.org-திட்டத்தில் இதன் பயன்பாடு
- nl.wikipedia.org-திட்டத்தில் இதன் பயன்பாடு
- no.wikipedia.org-திட்டத்தில் இதன் பயன்பாடு
- pt.wikipedia.org-திட்டத்தில் இதன் பயன்பாடு
- ro.wikipedia.org-திட்டத்தில் இதன் பயன்பாடு
- ru.wikipedia.org-திட்டத்தில் இதன் பயன்பாடு
- sr.wikipedia.org-திட்டத்தில் இதன் பயன்பாடு
- sv.wikipedia.org-திட்டத்தில் இதன் பயன்பாடு
- te.wikipedia.org-திட்டத்தில் இதன் பயன்பாடு
- tg.wikipedia.org-திட்டத்தில் இதன் பயன்பாடு
- tr.wikipedia.org-திட்டத்தில் இதன் பயன்பாடு
- uk.wikipedia.org-திட்டத்தில் இதன் பயன்பாடு
- zh.wikipedia.org-திட்டத்தில் இதன் பயன்பாடு