படிமம்:World population growth rate 1950–2050.svg

Size of this PNG preview of this SVG file: 800 × 379 படப்புள்ளிகள். மற்ற பிரிதிறன்கள்: 320 × 152 படப்புள்ளிகள் | 640 × 303 படப்புள்ளிகள் | 1,024 × 485 படப்புள்ளிகள் | 1,280 × 606 படப்புள்ளிகள் | 2,560 × 1,213 படப்புள்ளிகள் | 1,900 × 900 படப்புள்ளிகள் .
மூலக்கோப்பு (SVG கோப்பு, பெயரளவில் 1,900 × 900 பிக்சல்கள், கோப்பு அளவு: 13 KB)
| இது விக்கிமீடியா பொதுக்கோப்பகத்தில் இருக்கும் ஒரு கோப்பாகும். இக்கோப்பைக் குறித்து அங்கே காணப்படும் படிம விளக்கப் பக்கத்தை இங்கே கீழே காணலாம்.
|
சுருக்கம்
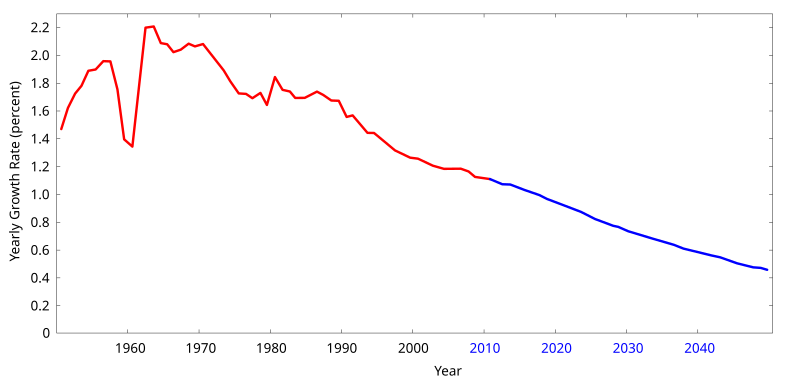
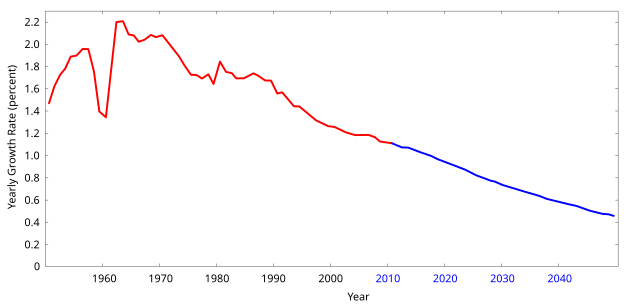
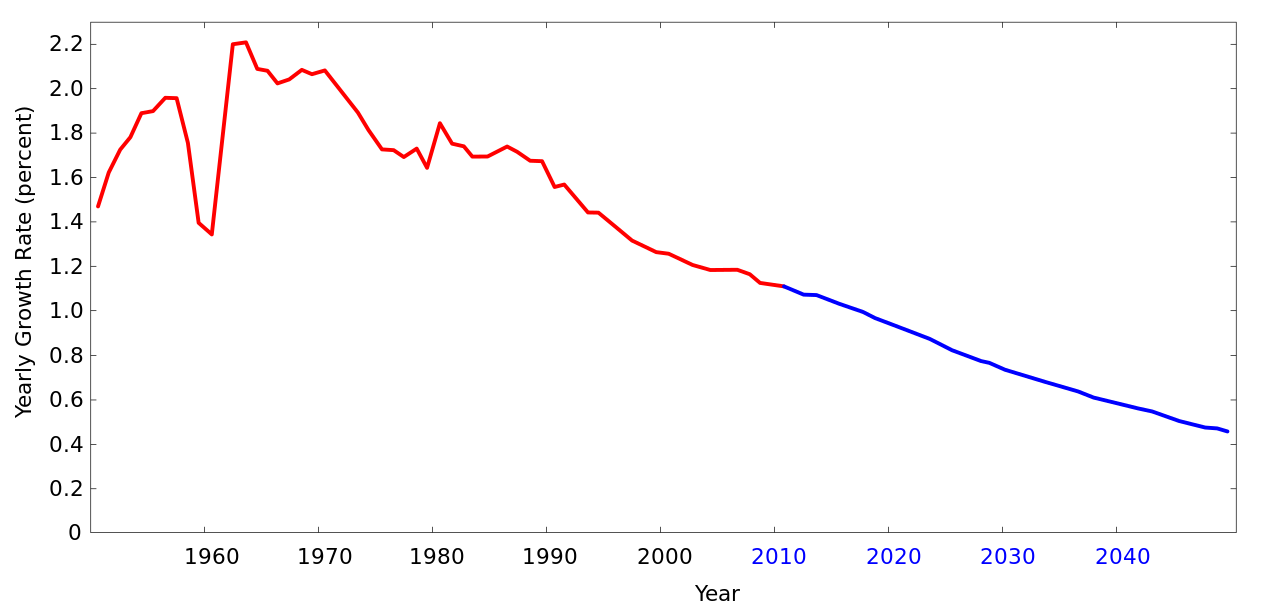
A chart of changes in world population growth rate from 1950–2010 (red) and predicted changes in world population growth rate from 2010–2050 (blue).
The original was created 6 Dec 2003 by Securiger from data provided by the U.S. Census Bureau.
Converted to SVG by Conscious.
History on English Wikipedia
- (Delete all revisions of this file) (cur) 22:14, 27 March 2006 . . Casito (Talk | contribs | block) . . 1200×900 (11,907 bytes) (Excel Graphs look unprofessional. This is done in GNUPlot using the same source data. Also adjusted to show the more useful percent growth (vs. abs. growth))
- (del) (rev) 15:50, 26 August 2005 . . Riumplus (Talk | contribs | block) . . 512×400 (3,103 bytes) (Removed unused colours from the PNG pallete, shrinking the file size by 41%)
- (del) (rev) 13:23, 6 December 2003 . . Securiger (Talk | contribs | block) . . 512×400 (5,242 bytes) (A chart of changes in world population 1952-2002)
அனுமதி
| இந்த கோப்பு Creative Commons Attribution-Share Alike 3.0 Unported உரிமத்தின் கீழ் உள்ளது. Subject to disclaimers. | ||
| ||
| This licensing tag was added to this file as part of the GFDL licensing update. |

|
GNU Free Documentation License விதிமுறைகளின் கீழ் இந்த ஆவணத்தை நகலெடுக்க, விநியோகிக்க மற்றும்/அல்லது மாற்றுவதற்கு அனுமதி வழங்கப்பட்டுள்ளது, Free Software Foundation;ஆல் வெளியிடப்பட்ட பதிப்பு 1.2 அல்லது அதற்குப் பிந்தைய பதிப்பு, மாற்றமில்லாத பிரிவுகள், முன் அட்டை உரைகள் மற்றும் பின் அட்டை உரைகள் இல்லாமல் வெளியிடப்பட்டது. GNU Free Documentation License என்ற தலைப்பில் உரிமத்தின் நகல் சேர்க்கப்பட்டுள்ளது. Subject to disclaimers. |
கோப்பின் வரலாறு
குறித்த நேரத்தில் இருந்த படிமத்தைப் பார்க்க அந்நேரத்தின் மீது சொடுக்கவும்.
| நாள்/நேரம் | நகம் அளவு சிறுபடம் | அளவுகள் | பயனர் | கருத்து | |
|---|---|---|---|---|---|
| தற்போதைய | 15:35, 27 சூலை 2010 | | 1,900 × 900 (13 KB) | Ninjatacoshell | Fixed graph points to align more closely with the original source data, added predicted growth rates for 2010–2050, and filled in axis labels. |
| 15:06, 10 சூலை 2006 |  | 1,200 × 900 (4 KB) | Conscious | viewable area too small | |
| 15:03, 10 சூலை 2006 |  | 1,100 × 900 (4 KB) | Conscious | edited svg | |
| 11:58, 10 சூலை 2006 |  | 1,200 × 900 (14 KB) | Conscious | ==Summary== A chart of changes in world population 1952-2002 Created 6 Dec 2003 by Securiger from data provided by U.S. Bureau of the Census Converted to SVG by ~~~. ==History on English Wikipedia== * (Delete all revisions of this f |
கோப்பு பயன்பாடு
பின்வரும் பக்க இணைப்புகள் இப் படிமத்துக்கு இணைக்கபட்டுள்ளது(ளன):
கோப்பின் முழுமையான பயன்பாடு
கீழ்கண்ட மற்ற விக்கிகள் இந்த கோப்பை பயன்படுத்துகின்றன:
- ar.wikipedia.org-திட்டத்தில் இதன் பயன்பாடு
- bg.wikipedia.org-திட்டத்தில் இதன் பயன்பாடு
- cs.wikipedia.org-திட்டத்தில் இதன் பயன்பாடு
- el.wikipedia.org-திட்டத்தில் இதன் பயன்பாடு
- en.wikipedia.org-திட்டத்தில் இதன் பயன்பாடு
- es.wikipedia.org-திட்டத்தில் இதன் பயன்பாடு
- fi.wikipedia.org-திட்டத்தில் இதன் பயன்பாடு
- hy.wikipedia.org-திட்டத்தில் இதன் பயன்பாடு
- id.wikipedia.org-திட்டத்தில் இதன் பயன்பாடு
- it.wikipedia.org-திட்டத்தில் இதன் பயன்பாடு
- jv.wikipedia.org-திட்டத்தில் இதன் பயன்பாடு
- ko.wikipedia.org-திட்டத்தில் இதன் பயன்பாடு
- no.wikipedia.org-திட்டத்தில் இதன் பயன்பாடு
- ru.wikipedia.org-திட்டத்தில் இதன் பயன்பாடு
- uk.wikipedia.org-திட்டத்தில் இதன் பயன்பாடு
- uz.wikipedia.org-திட்டத்தில் இதன் பயன்பாடு
- vi.wikipedia.org-திட்டத்தில் இதன் பயன்பாடு