வறுமையில் வாழும் மக்கள் தொகை வீதத்தின் அடிப்படையில் நாடுகளின் பட்டியல்

விக்கிப்பீடியா:பட்டியலிடல்

இது ஒரு வறுமையில் வாழும் மக்கள் தொகை வீதத்தின் அடிப்படையில் நாடுகளின் பட்டியல் ஆகும்.
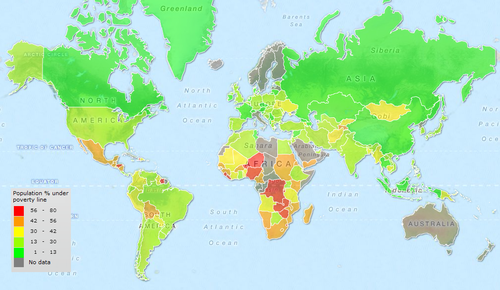
வறுமையில் வாழும் மக்கள் தொகை வீதம்.

நாடுகள் தொகு

1.25 இற்கு கீழ் வாழும் மக்கள் தொகை,
நாளுக்கு 2 டொலர் (PPP), 4 டொலர் (%)
தேசிய வறுமைக் கோட்டுக்கு கீழ் வாழும் மக்கள் தொகை (%)
நாடு < $1.25[1] < $2[1] ஆண்டு < $4[2][3] ஆண்டு
  Albania 0.5 3.00 2012 31.5 2012
  Algeria 6.79 23.61 1995 63 1995
  Angola 43.4 67.4 2009 90.6 2009
  Argentina 1.4 2.9 2011 11.6[4] 2011
  Armenia 1.28 12.43 2008 65.1 2012
  Azerbaijan 19.8 2015
  Bangladesh 29 76.54 2012 [5] 95.7 2010
  Belarus 0.10 0.19 2008 .3 2011
  Belize 12.21 22.00 1999 52.9 1999
  Benin 51.6 74.3 2012 92.5 2011
  Bhutan 2.4 15.2 2012 52.8 2012
  Bolivia 8.0 12.7 2012 29.3 2012
  Bosnia and Herzegovina 0.04 0.19 2007 1.7 2007
  Botswana 13.4 27.8 2009 55 09
  Brazil 2.1 2.3 2012 20.8 2012
  Bulgaria 1.9 3.9 2011 11.3 2011
  Burkina Faso 44.60 72.56 2009 93.5 2009
  Burundi 81.32 93.45 2006 98.8 2006
  Cambodia 22.75 53.27 2008 85.7 2011
  Cameroon 9.56 30.36 2007 84.1 2007
  Cape Verde 21.02 40.85 2002
  Central African Republic 62.83 80.09 2008 94.2 2008
  Chad 61.94 83.28 2003 88.2 2011
  Chile 0.8 1.9 2011 9.9 2011
  China 6.3 18.6 2011 49.1 2011
  Colombia 5.6 12.0 2012 32.9 2012
  Comoros 46.11 64.98 2004
  Congo, Democratic Republic of the 23.72 46.15 2006 98.9 2005
  Congo, Republic of the 32.8 57.3 2011 87.6 2011
  Costa Rica 1.4 3.1 2012 12.2 2012
  Côte d'Ivoire 23.75 46.34 2008 87.2 2008
  Croatia 0.06 0.09 2008 .3 2008
  Czech Republic 0.00 0.00 2009 .3 2011
  Djibouti 18.84 41.20 2002 78.9 2002
  Dominican Republic 2.24 8.8 2012 33.3 2012
  East Timor 37.44 72.82 2007
  Ecuador 4.0 8.4 2012 27.8 2012
  Egypt 1.69 15.43 2008 71.6 2008
  El Salvador 2.5 8.8 2012 34.8 2012
  Estonia 0.46 0.9 2009 3.3 2011
  Ethiopia 36.8 72.2 2011 95.4 2010
  Fiji 5.88 22.90 2009 61.8 2008
  Gabon 4.84 19.59 2005 56.6 2005
  Gambia, The 48.4 55.93 2010 [6] 83.6 2003
  Georgia 15.27 32.21 2008 67.9 2012
  Ghana 28.59 51.84 2006 84.1 2005
  Guatemala 13.53 26.33 2006 62.4 2011
  Guinea 40.9 72.7 2012 95.1 2012
  Guinea-Bissau 48.90 77.96 2002 95.8 2002
  Guyana 8.70 18.02 1998 45.5 1998
  Haiti 61.71 77.51 2001 90.7 2002
  Honduras 16.5 29.2 2011 56.4 2011
  Hungary 0.07 0.18 2002 2.5 2011
  India 14.7 59.2 2011 [7] 91.2 2011
  Indonesia 18.06 43.3 2010 80.5 2011
  Iran 1.45 8.03 2005 36.7 2005
  Iraq 3.9 21.2 2012 71.8 2012
  Jamaica 0.21 5.44 2004 29.6 2004
  Jordan 0.12 1.59 2010 26.5 2010
  Kazakhstan 0.11 1.12 2009 17.5 2010
  Kenya 43.37 67.21 2005 90 2005
  Kyrgyzstan 6.23 21.69 2009 67 2011
  Laos 33.88 62.00 2012 91.4 2012
  Latvia 0.14 0.37 2008 7.3 2011
  Lesotho 43.41 62.25 2003
  Liberia 83.76 94.88 2007 99 2007
  Lithuania 0.16 0.44 2008 4.7 2011
  Macedonia, Republic of 0.00 5.91 2009 24.8 2008
  Madagascar 81.29 92.62 2010 99 2010
  Malawi 73.86 90.45 2004 97.2 2010
  Malaysia 0.00 2.27 2009 17.9 2009
  Mali 50.43 78.66 2010 96.4 2010
  Mauritania 23.43 47.69 2008 83.2 2008
  Mexico 1.00 4.1 2012 21.3 2012
  Micronesia, Federated States of 31.15 44.69 2000
  Moldova 0.2 2.8 2011 29 2011
  Montenegro 0.2 0.70 2011 8.9 2011
  Morocco 2.52 14.03 2007 52.9 2007
  Mozambique 59.58 81.77 2008 96.1 2009
  Namibia 23.5 43.20 2010 68.8 2009
  Nepal 23.7 56.0 2010 90.1 2010
  Nicaragua 8.5 20.8 2009 52.2 2009
  Niger 43.62 75.23 2008 96 2011
  Nigeria 62.0 82.2 2010 95.7 2010
  Pakistan 22.7 50.7 2011 91.1 2010
  Panama 4.0 8.9 2012 20.9 2012
  Papua New Guinea 35.79 57.38 1996 83 1996
  Paraguay 3.0 7.7 2012 23.8 2012
  Peru 2.9 8.0 2012 23.3 2012
  Philippines 10.42 21.53 2009 75.2 2012
  Poland 0.05 0.20 2009 4.3 2011
  Romania 0.41 1.67 2009 18.3 2012
  Russia 5.3 2009
  Rwanda 63.17 82.37 2011 95.5 2011
  Saint Lucia 20.93 40.58 1995
  São Tomé and Príncipe 28.18 54.20 2001
  Senegal 33.50 60.36 2005 88.8 2011
  Serbia 0.25 1.14 2004 7.6 2010
  Seychelles 0.25 1.84 2007
  Sierra Leone 53.37 76.08 2003 96.5 2011
  Slovakia 0.3 0.5 2011 1.2 2011
  Slovenia 0.00 0.00 2008
  South Africa 9.40 26.2 2011 50.3 2011
  Sri Lanka 4.1 23.9 2010 69.9 2009
  Sudan 19.80 44.14 2009 83.5 2009
  Suriname 15.54 27.20 1999 52.9 1999
  Swaziland 39.3 60.40 2010 82.8 2009
  Syria 1.71 16.85 2004 60 2004
  Tajikistan 6.56 27.69 2009 74.9 2009
  Tanzania 43.50 73.0 2012 94 2012
  Thailand 0.37 3.5 2010 31 2010
  Togo 38.68 69.31 2006 91.4 2011
  Trinidad and Tobago 4.16 13.53 1992
  Tunisia 0.7 4.5 2010 26.3 2010
  Turkey 0.1 2.6 2011 13.9 2011
  Turkmenistan 24.82 49.65 1998 83 1998
  Uganda 37.8 62.9 2013 88.2 2012
  Ukraine 0.06 0.17 2009 1.8 2010
  Uruguay 0.30 1.3 2012 8.2 2012
  Venezuela 6.63 12.91 2006 36.7 2006
  Vietnam 2.4 12.50 2012 48.5 2012
  West Bank and Gaza 0.04 0.34 2009
  Yemen 17.53 46.60 2005 82 2005
  Zambia 68.51 82.55 2006 95.7 2010
நாடு உலக வங்கி[8] ஆண்டு சிஐஏ[9] ஆண்டு பிற ஆண்டு
  Afghanistan 15.8 2011 16 FY08/09 இல்லை இல்லை
  Albania 14.3 2012 12.5 2008 est. இல்லை இல்லை
  Algeria 22.6 1995 23 2006 est. இல்லை இல்லை
  Andorra இல்லை இல்லை இல்லை இல்லை இல்லை இல்லை
  Angola 36.6 2008 40.5 2006 est. இல்லை இல்லை
  Anguilla இல்லை இல்லை 23 2002 இல்லை இல்லை
  Argentina இல்லை இல்லை 30 2013[10] 5.4 2013[11]
  Armenia 27.6 2008 34.1 2009 est. இல்லை இல்லை
  Austria இல்லை இல்லை 6 2008 இல்லை இல்லை
  Azerbaijan 7.6 2011 6 2012 est. இல்லை இல்லை
  Bahamas, The இல்லை இல்லை 9.3 2004 இல்லை இல்லை
  Bangladesh 31.5 2010 26 2012 est. இல்லை இல்லை
  Belarus 7.3 2011 27.1 2003 est. இல்லை இல்லை
  Belgium இல்லை இல்லை 15.2 2007 est. இல்லை இல்லை
  Belize 33.5 2002 43 2010 est. இல்லை இல்லை
  Benin 36.2 2011 37.4 2007 est. இல்லை இல்லை
  Bermuda இல்லை இல்லை 19 2000 இல்லை இல்லை
  Bhutan 23.2 2007 23.2 2008 இல்லை இல்லை
  Bolivia 45.0 2011 51.3 2009 est.[12] 54.0 2007[13]
  Bosnia and Herzegovina 17.9 2011 18.6 2007 est. இல்லை இல்லை
  Botswana 19.3 2009 30.3 2003 இல்லை இல்லை
  Brazil 10.0 2013 21.4 2013 12.1 2011[13]
  Bulgaria 20.7 2009 21.8 2008 இல்லை இல்லை
  Burkina Faso 46.7 2009 46.4 2004 இல்லை இல்லை
  Burma இல்லை இல்லை 32.7 2007 est. இல்லை இல்லை
  Burundi 66.9 2006 68 2002 est. இல்லை இல்லை
  Cambodia 30.1 2007 31 2007 est. இல்லை இல்லை
  Cameroon 39.9 2007 48 2000 est. இல்லை இல்லை
  Canada இல்லை இல்லை 9.4 2008[14] 4.9 2004[15]
  Cape Verde 26.6 30 2007/2000 இல்லை இல்லை
  Central African Republic 62 2008 இல்லை இல்லை இல்லை இல்லை
  Chad 46.7 2011 80 2001 est. இல்லை இல்லை
  Chile 14.4 2011 11.5 2012 10.4 2011[16]
  China இல்லை இல்லை 13.4 2011[17] இல்லை இல்லை
  Colombia 32.7 2012 32.7 2012 est. 45.5 2012[13]
  Comoros 44.8 2004 60 2002 est. இல்லை இல்லை
  Congo, Democratic Republic of the 71.3 2006 71 2006 est. இல்லை இல்லை
  Congo, Republic of the 46.5 2011 இல்லை இல்லை இல்லை இல்லை
  Costa Rica 20.6 2012 24.8 2011 est. 18.9 2009[13]
  Côte d'Ivoire 42.7 2008 42 2006 est. இல்லை இல்லை
  Croatia 11.1 2004 18 2009 இல்லை இல்லை
  Czech Republic 8.6 2012 9 2010 est. இல்லை இல்லை
  Denmark இல்லை இல்லை 13.4 2011 இல்லை இல்லை
  Djibouti இல்லை இல்லை 42 2007 est. இல்லை இல்லை
  Dominica இல்லை இல்லை 29 2009 est. இல்லை இல்லை
  Dominican Republic 34.4 2010 34.4 2010 est. 41.1 2009[13]
  East Timor 49.9 2007 41 2009 est. இல்லை இல்லை
  Ecuador 27.3 2012 28.6 December 2011 40.2 2009[13][18]
  Egypt 25.2 2011 20 2005 est. இல்லை இல்லை
  El Salvador 34.5 2012 36.5 2010 est. 47.9 2009[13]
  Equatorial Guinea 76.8 2006 இல்லை இல்லை இல்லை இல்லை
  Eritrea 69 1993 50 2004 est. இல்லை இல்லை
  Estonia இல்லை இல்லை 17.5 2010 இல்லை இல்லை
  Ethiopia 38.9 2005 29.2 FY09/10 est. இல்லை இல்லை
  Fiji 31 2009 25.5 FY90/91 இல்லை இல்லை
  France இல்லை இல்லை 6.2 2004 இல்லை இல்லை
  Gabon 32.7 2005 இல்லை இல்லை இல்லை இல்லை
  Gambia, The 48.4 2010 இல்லை இல்லை இல்லை இல்லை
  Gaza Strip இல்லை இல்லை 38 2010 est. இல்லை இல்லை
  Georgia 17.7 2011 9.7 2010 இல்லை இல்லை
  Germany இல்லை இல்லை 15.5 2010 est. இல்லை இல்லை
  Ghana 24.2 2012 28.5 2007 est. இல்லை இல்லை
  Greece இல்லை இல்லை 20 2009 est. இல்லை இல்லை
  Greenland இல்லை இல்லை 9.2 2007 est. இல்லை இல்லை
  Grenada இல்லை இல்லை 38 2008 இல்லை இல்லை
  Guam இல்லை இல்லை 23 2001 est. இல்லை இல்லை
  Guatemala 53.7 2011 54 2011 est. 54.8 2006[13]
  Guinea-Bissau 69.3 2010 இல்லை இல்லை இல்லை இல்லை
  Guinea 55.2 2012 47 2006 est. இல்லை இல்லை
  Guyana இல்லை இல்லை 35 2006 இல்லை இல்லை
  Haiti 58.5 2012 80 2003 est. இல்லை இல்லை
  Honduras 60 2010 65 2010 68.9 2007[13]
  Hungary 12.2 2009 13.9 2010 இல்லை இல்லை
  India 21.9[19] 2012 இல்லை இல்லை இல்லை இல்லை
  Indonesia 12.5 2011 13.33 2010 இல்லை இல்லை
  Iran இல்லை இல்லை 18.7 2007 est. இல்லை இல்லை
  Iraq 22.9 2007 25 2008 est. இல்லை இல்லை
  Italy இல்லை இல்லை 29.9 2012 10.3 2014[20]
  Ireland இல்லை இல்லை 5.5 2009 6.8 2004 est.[21]
  Israel இல்லை இல்லை 23.6 2007[22] இல்லை இல்லை
  Jamaica 17.6 2010 16.5 2009 est. இல்லை இல்லை
  Japan இல்லை இல்லை 16 2007[23] இல்லை இல்லை
  Jordan 14.4 2010 14.2 2002 இல்லை இல்லை
  Kazakhstan 8.2 2009 8.2 2009 இல்லை இல்லை
  Kenya 45.9 2005 50 2000 est. இல்லை இல்லை
  Korea, South இல்லை இல்லை 15 2006 est. இல்லை இல்லை
  Kosovo 29.2 2010 30 2010 est. இல்லை இல்லை
  Kyrgyzstan 33.7 2010 33.7 2011 est. இல்லை இல்லை
  Laos 27.6 2008 26 2010 est. இல்லை இல்லை
  Latvia 5.9 2004 இல்லை இல்லை இல்லை இல்லை
  Lebanon இல்லை இல்லை 28 1999 est. இல்லை இல்லை
  Lesotho 56.6 2003 49 1999 இல்லை இல்லை
  Liberia 63.8 2007 80 2000 est. இல்லை இல்லை
  Libya இல்லை இல்லை See note. [24] இல்லை இல்லை
  Lithuania இல்லை இல்லை 4 2008 இல்லை இல்லை
  Macedonia, Republic of 27.1 2010 30.9 2010 30.4 2011[25]
  Madagascar 75.3 2010 50 2004 est. இல்லை இல்லை
  Malawi 50.7 2010 53 2004 இல்லை இல்லை
  Malaysia 3.8 2009 3.8 2007 est. இல்லை இல்லை
  Maldives இல்லை இல்லை 16 2008 இல்லை இல்லை
  Mali 43.6 2010 36.1 2005 est. இல்லை இல்லை
  Mauritania 42 2008 40 2004 est. இல்லை இல்லை
  Mauritius இல்லை இல்லை 8 2006 est. இல்லை இல்லை
  Mexico 51.3 2010 48.0 2013 48.0 2013[13]
  Micronesia, Federated States of இல்லை இல்லை 26.7 2000 இல்லை இல்லை
  Moldova 16.6 2012 26.3 2009 இல்லை இல்லை
  Mongolia 27.4 2012 39.2 2010 இல்லை இல்லை
  Montenegro 11.3 2012 6.6 2010 est. இல்லை இல்லை
  Morocco 9 2007 15 2007 est. இல்லை இல்லை
  Mozambique 54.7 2009 54 2008 est. இல்லை இல்லை
  Namibia 28.7 2009 55.8 2005 est.[26] இல்லை இல்லை
  Nepal 25.2 2011 25.2 2011 இல்லை இல்லை
  Netherlands இல்லை இல்லை 10.5 2005 இல்லை இல்லை
  Nicaragua 42.5 2009 46.2 2005 61.9 2005[13]
  Niger 59.5 2007 63 1993 est. இல்லை இல்லை
  Nigeria 46.0 2010 70 2007 est. இல்லை இல்லை
  Norway இல்லை இல்லை இல்லை இல்லை 4.3 2007[27]
  Pakistan 22.3 2006 22.3 FY05/06 est. 2013 21%[28]
  Panama 27.6 2011 26 2012 est. 26.4 2009[13]
  Papua New Guinea 39.9 2009 37 2002 est. இல்லை இல்லை
  Paraguay 26.9 2012 34.7 2010 est. 56.0 2009[13]
  Peru 25.8 2012 31.3 2010 34.8 2009[13]
  Philippines 25.2 2012 26.5 2009 est. இல்லை இல்லை
  Poland 7.6 2008 10.2 2003 est. இல்லை இல்லை
  Portugal இல்லை இல்லை 18 2006 இல்லை இல்லை
  Romania 13.8 2006 22.2 2011 est. இல்லை இல்லை
  Russia 12.7 2011 13.1 2010 13.1 Dec. 2008[29]
  Rwanda 44.9 2011 60 2001 est. இல்லை இல்லை
  São Tomé and Príncipe 61.7 2009 54 2004 est. இல்லை இல்லை
  Senegal 46.7 2011 54 2001 est. இல்லை இல்லை
  Serbia 24.6 2011 9.1 2013 est. இல்லை இல்லை
  Sierra Leone 52.9 2011 70.2 2004 இல்லை இல்லை
  Slovakia 13.2 2011 21 2002 இல்லை இல்லை
  Slovenia இல்லை இல்லை 12.3 2008 இல்லை இல்லை
  South Africa 23 2006 31.3 2009 est. இல்லை இல்லை
  South Sudan 50.6 2009 இல்லை இல்லை இல்லை இல்லை
  Spain இல்லை இல்லை 19.8 2005 21.1 2012[30]
  Sri Lanka 8.9 2010 8.9 2009 est. இல்லை இல்லை
  Sudan 46.5 2009 40 2004 est. இல்லை இல்லை
  Suriname இல்லை இல்லை 70 2002 est. இல்லை இல்லை
  Swaziland 63.0 2009 69 2006 இல்லை இல்லை
  Switzerland இல்லை இல்லை 6.9 2010 இல்லை இல்லை
  Syria இல்லை இல்லை 11.9 2006 est. இல்லை இல்லை
  Taiwan இல்லை இல்லை 1.16 2010 est. இல்லை இல்லை
  Tajikistan 46.7 2009 53 2009 est. இல்லை இல்லை
  Tanzania 28.2 2012 36 2002 est. இல்லை இல்லை
  Thailand 13.2 2011 8.1 2009 est. இல்லை இல்லை
  Togo 58.7 2011 32 1989 est. இல்லை இல்லை
  Tonga இல்லை இல்லை 24 FY03/04 இல்லை இல்லை
  Trinidad and Tobago இல்லை இல்லை 17 2007 est. இல்லை இல்லை
  Tunisia 15.5 2010 3.8 2005 est. 3.8 2005[31]
  Turkey 18.1 2009 16.9 2010 20.5 2005[32]
  Turkmenistan இல்லை இல்லை 30 2004 est. இல்லை இல்லை
  Uganda 24.5 2009 35 2001 est. இல்லை இல்லை
  Ukraine 7.8 2011 24.1 2010 24.3 2013[33]
  United Arab Emirates இல்லை இல்லை 19.5 2003 0.0 2011[34]
  United Kingdom இல்லை இல்லை 14 2006 est. இல்லை இல்லை
  United States இல்லை இல்லை 15.1 2010 est. 14.5 2013[35]
  Uruguay 12.4 2012 18.6 2010 est. 6.7 2012[36]
  Uzbekistan 16.0 2011 26 2008 est. இல்லை இல்லை
  Venezuela 25.4 2012 31.6 2011 est. 27.6 2008[13]
  Vietnam 17.2 2012 14.5 2010 est. இல்லை இல்லை
  Virgin Islands, U.S. இல்லை இல்லை 28.9 2002 இல்லை இல்லை
  West Bank இல்லை இல்லை 18.3 2010 est. இல்லை இல்லை
  West Bank and Gaza 25.8 2011 இல்லை இல்லை இல்லை இல்லை
  Yemen 34.8 2005 45.2 2003 இல்லை இல்லை
  Zambia 59.3 2006 64 2006 இல்லை இல்லை
  Zimbabwe 72.3 2011 68 2004 இல்லை இல்லை

மேலும் காண்க தொகு


உசாத்துணை தொகு

  1. 1.0 1.1 "World Development Indicators". உலக வங்கி. July 9, 2012. பார்க்கப்பட்ட நாள் July 25, 2012.
  2. http://povertydata.worldbank.org/poverty/region/LAC | Retrieved May 12, 2015
  3. World DataBank Poverty and Inequality Database |http://databank.worldbank.org/data/views/variableselection/selectvariables.aspx?source=Poverty-and-Inequality-Database | http://databank.worldbank.org/data/views/reports/tableview.aspx , Poverty headcount ratio at $4 a day (PPP) (% of population) |Retrieved May 12, 2015
  4. urban only
  5. "Bangladesh People Under $1". nationmaster. பார்க்கப்பட்ட நாள் 22 July 2013.
  6. August 2014 "The Gambian Population Below Poverty Line". {{cite web}}: Check |url= value (help)
  7. http://www.brookings.edu/blogs/up-front/posts/2014/05/05-data-extreme-poverty-chandy-kharas
  8. "World Databank". Databank.worldbank.org. பார்க்கப்பட்ட நாள் 2012-11-17.
  9. Population below poverty line பரணிடப்பட்டது 2016-12-21 at the வந்தவழி இயந்திரம், த வேர்ல்டு ஃபக்ட்புக், நடுவண் ஒற்று முகமை, accessed on July 25, 2012.
  10. "காப்பகப்படுத்தப்பட்ட நகல்". Archived from the original on 2016-12-21. பார்க்கப்பட்ட நாள் 2015-10-07.
  11. http://www.cadena3.com/contenido/2013/04/24/112569.asp?titulo=El-Indec-informo-que-la-pobreza-bajo-al-54%-a-fines-de-2012
  12. Based on percent of population living on less than the international standard of $2/day (2009 est.).
  13. 13.00 13.01 13.02 13.03 13.04 13.05 13.06 13.07 13.08 13.09 13.10 13.11 13.12 13.13 13.14 "Panorama social de América Latina 2010" (PDF). ECLAC (in Spanish). Archived from the original (PDF) on ஜூலை 7, 2011. பார்க்கப்பட்ட நாள் December 1, 2010. {{cite web}}: Check date values in: |archive-date= (help)CS1 maint: unrecognized language (link)
  14. This figure is the Low Income Cut-Off (LICO), a calculation that results in higher figures than found in many comparable economies; Canada does not have an official poverty line (2008).
  15. Basic Needs Poverty Measure பரணிடப்பட்டது 2010-04-01 at the வந்தவழி இயந்திரம், an absolute poverty measure calculated by the ஃபிரேசர் நிறுவனம். (See related article, Poverty in Canada.)
  16. "La CASEN 2011, precisiones de la CEPAL" (PDF) (in Spanish). United Nations Economic Commission for Latin America and the Caribbean. 1 September 2012. Archived from the original (PDF) on 25 பிப்ரவரி 2021. பார்க்கப்பட்ட நாள் 1 September 2012. {{cite web}}: Check date values in: |archive-date= (help)CS1 maint: unrecognized language (link) Note: The figure is on page 5 of the report.
  17. In 2011, China set a new poverty line at RMB 2300 (approximately US $363; this new standard is significantly higher than the line set in 2009, and as a result, 128 million Chinese are now considered below the poverty line (2011).
  18. Urban areas.
  19. http://databank.worldbank.org/data/views/reports/tableview.aspx?isshared=true
  20. http://www.istat.it/en/archive/164876
  21. "காப்பகப்படுத்தப்பட்ட நகல்". Archived from the original on 2007-02-04. பார்க்கப்பட்ட நாள் 2015-10-07.
  22. Israel's poverty line is $7.30 per person per day (2007).
  23. Ministry of Health, Labor and Welfare (MHLW) press release, 20 October 2009 (2010).
  24. About one-third of Libyans live at or below the national poverty line.
  25. "Poverty Line" (PDF). Stat.gov.mk. பார்க்கப்பட்ட நாள் 2012-11-17.
  26. The UNDP's 2005 Human Development Report indicated that 34.9% of the population live on $1 per day and 55.8% live on $2 per day (2005 est.).
  27. Poverty data: http://www.state.gov/g/drl/rls/hrrpt/2007/100577.htm Norway. Country Reports on Human Rights Practices – 2007], US Department of State; Population: Norway – CIA The World Factbook பரணிடப்பட்டது 2015-10-16 at the வந்தவழி இயந்திரம்.
  28. "Below the line: Increasing poverty affecting 40% population, says report". The Express Tribune. http://tribune.com.pk/story/661634/below-the-line-increasing-poverty-affecting-40-population-says-report/. பார்த்த நாள்: 11 June 2014. 
  29. [https://web.archive.org/web/20100516042919/http://www.gks.ru/bgd/free/B04_03/IssWWW.exe/Stg/d03/235.htm பரணிடப்பட்டது 2010-05-16 at the வந்தவழி இயந்திரம் பரணிடப்பட்டது 2010-05-16 at the வந்தவழி இயந்திரம் பரணிடப்பட்டது 2010-05-16 at the வந்தவழி இயந்திரம் பரணிடப்பட்டது 2010-05-16 at the வந்தவழி இயந்திரம் பரணிடப்பட்டது 2010-05-16 at the வந்தவழி இயந்திரம் Structure of money incomes and share of expenditures in money incomes of population (உருசிய மொழியில்)] பரணிடப்பட்டது 2010-05-16 at the வந்தவழி இயந்திரம்.
  30. "El 21,1% de la población española, por debajo del umbral de pobreza". cadenaser.com. பார்க்கப்பட்ட நாள் 2015-07-04.
  31. "Newsletter-ang.pub" (PDF). Investintunisia.tn. Archived from the original (PDF) on 2012-04-26. பார்க்கப்பட்ட நாள் 2012-11-17.
  32. "::Welcome to Turkish Statistical Institute(TurkStat)'s Web Pages::". TurkStat. Archived from the original on 2018-12-26. பார்க்கப்பட்ட நாள் 2012-11-17.
  33. "காப்பகப்படுத்தப்பட்ட நகல்". Archived from the original on 2018-04-11. பார்க்கப்பட்ட நாள் 2015-10-07.
  34. Fatema Al Kamali and Hamda Al Bastaki. "Any poor Emiratis out there? - The National". Thenational.ae. பார்க்கப்பட்ட நாள் 2012-11-17.
  35. "Income, Poverty and Health Insurance Coverage in the United States: 2013". US Census.
  36. http://www.diariotextual.com/economia/item/1764-cepal-argentina-es-el-pa%C3%ADs-con-menos-pobreza-de-am%C3%A9rica-latina.html பரணிடப்பட்டது 2015-12-24 at the வந்தவழி இயந்திரம்.

வெளி இணைப்புகள் தொகு